

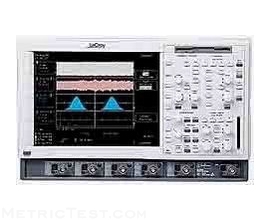
Description
Lecroy LT342L oscilloscope is a graph-displaying device – it draws a graph of an electrical signal. In most applications, the graph shows how signals change over time: the vertical (Y) axis represents voltage and the horizontal (X) axis represents time. The intensity or brightness of the display is sometimes called the Z axis.
Lecroy LT342L oscilloscope’s simple graph can tell you many things about a signal, such as: the time and voltage values of a signal, the frequency of an oscillating signal, the “moving parts” of a circuit represented by the signal, the frequency with which a particular portion of the signal is occurring relative to, other portions, whether or not a malfunctioning component is distorting the signal, how much of a signal is direct current (DC) or alternating current (AC) and how much of the signal is noise and whether the noise is changing with time.
Lecroy LT342L Features
- Bandwidth: 500 MHz
- Channels: 2
- Sample Rate: 500 MSa/sec
- Memory Depth: 1 Mpts/Ch
- Max. Vertical Sensitivity: 10 V/div
- Min. Vertical Sensitivity: 2 mV/div
- Record Lentgh: 1000000 pt/sec
Lecroy LT342L Specification
- Frequency Range/ Bandwith 500 MHz
- Max. Vertical Sensitivity 10 V/div
- Min. Vertical Sensitivity 2 mV/div
- Number of Channels 2 CH
- Record Length 1000000 pt/sec
- Sample Rate 500 MSa/s – 500 MSa/s
- Type (D/A) Digital
Reviews
There are no reviews yet.